SPSS Data Analysis Help for Dissertation: A Complete Guide for University Students
Introduction
Collecting data is only one part of a successful dissertation. Once surveys, questionnaires, interviews, or experiments are complete, students must analyse their findings accurately and present meaningful results. For many undergraduate, postgraduate, and doctoral students, this stage can be the most challenging.
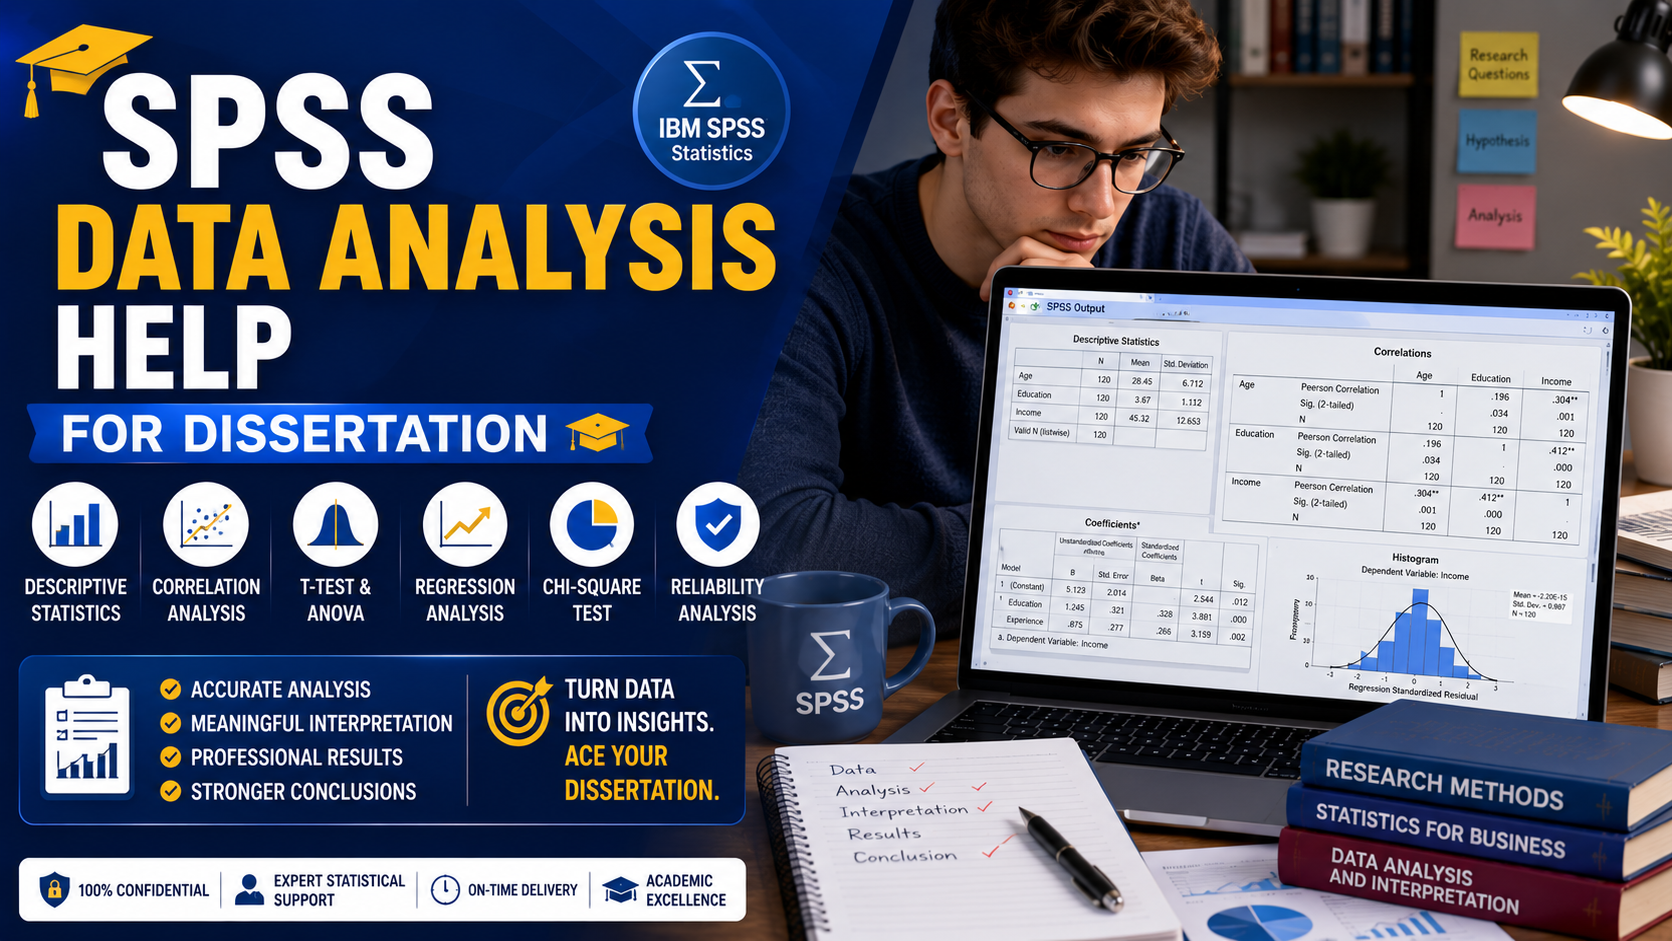
IBM SPSS Statistics (Statistical Package for the Social Sciences) is one of the most widely used statistical software packages in higher education. It enables researchers to organise data, perform statistical tests, generate charts, and interpret research findings.
Many students seek SPSS data analysis help for dissertations because they are unfamiliar with statistical concepts or the software itself. Ethical academic support—such as statistical guidance, data interpretation coaching, SPSS training, proofreading, and methodology advice—can help students understand and analyse their own research while maintaining academic integrity.
This guide explains how SPSS is used in dissertation research, common statistical tests, and best practices for analysing and reporting data.
What Is SPSS?
SPSS (Statistical Package for the Social Sciences) is statistical analysis software developed by IBM.
Researchers use SPSS to:
Organise research data
Clean datasets
Perform statistical analysis
Create graphs and charts
Test hypotheses
Generate tables
Produce research reports
SPSS is widely used across disciplines such as:
Business
Psychology
Nursing
Education
Sociology
Public Health
Economics
Marketing
Human Resource Management
Healthcare
Why Is SPSS Important for a Dissertation?
Statistical analysis allows researchers to transform raw data into meaningful conclusions.
Using SPSS can help you:
Analyse survey responses
Identify relationships between variables
Test research hypotheses
Summarise data clearly
Present professional tables and graphs
Support evidence-based conclusions
Accurate statistical analysis strengthens the credibility of your dissertation.
Common Types of Data Analysed in SPSS
Students commonly analyse:
Questionnaire responses
Survey data
Experimental results
Customer feedback
Employee satisfaction surveys
Healthcare research data
Educational research
Psychological assessments
Financial datasets
Key SPSS Analyses Used in Dissertations
1. Descriptive Statistics
Descriptive statistics summarise your data.
Common outputs include:
Mean
Median
Mode
Standard deviation
Frequency tables
Percentages
These statistics provide an overview of your dataset before further analysis.
2. Correlation Analysis
Correlation measures the relationship between two variables.
Examples:
Study hours and grades
Job satisfaction and productivity
Social media use and academic performance
Correlation does not necessarily imply causation.
3. Regression Analysis
Regression analysis examines how one or more independent variables influence a dependent variable.
It is widely used in:
Business research
Marketing studies
Economics
Psychology
Healthcare
4. Independent Samples t-Test
A t-test compares the means of two independent groups.
Example:
Comparing exam performance between online and classroom learners.
5. Paired Samples t-Test
This test compares results from the same participants before and after an intervention.
Example:
Employee performance before and after training.
6. ANOVA (Analysis of Variance)
ANOVA compares the means of three or more groups.
Example:
Comparing customer satisfaction across multiple service providers.
7. Chi-Square Test
The Chi-Square test examines relationships between categorical variables.
Example:
Gender and purchasing preferences.
8. Reliability Analysis
Researchers commonly use Cronbach's Alpha to evaluate questionnaire reliability.
A reliable questionnaire improves confidence in research findings.
Data Cleaning Before Analysis
Before running statistical tests, researchers should:
Remove duplicate responses
Check for missing values
Correct data entry errors
Verify coding consistency
Identify outliers
Clean data produces more reliable statistical results.
How to Interpret SPSS Results
Running a statistical test is only the first step.
Students should understand:
P-values
Statistical significance
Confidence intervals
Effect sizes
Correlation coefficients
Regression coefficients
Reliability scores
Interpretation should always relate back to the research objectives and hypotheses.
Presenting SPSS Results in Your Dissertation
The results chapter should include:
Tables
Graphs
Charts
Statistical outputs
Clear explanations
References to research questions
Avoid copying raw SPSS output directly into your dissertation. Instead, present only the relevant findings and explain their significance in clear academic language.
Common Mistakes Students Make
Avoid these common errors:
Choosing the wrong statistical test
Using poor-quality data
Ignoring assumptions of statistical tests
Misinterpreting p-values
Reporting results without explanation
Including unnecessary SPSS output
Drawing unsupported conclusions
How SPSS Data Analysis Help Can Support Students
Ethical academic support may include:
SPSS software guidance
Statistical concept explanation
Data cleaning advice
Test selection guidance
Output interpretation
Results presentation
Academic editing
Proofreading
Methodology feedback
These services are intended to improve your understanding and help you analyse your own research responsibly.
Can AI Help with SPSS Analysis?
AI tools can assist students by:
Explaining statistical concepts
Suggesting appropriate tests
Interpreting statistical terminology
Improving academic writing
Explaining SPSS outputs
However, students should verify all AI-generated explanations, understand the statistical methods they use, and ensure compliance with their university's AI and academic integrity policies.
Tips for Successful SPSS Data Analysis
To improve your dissertation analysis:
Plan your analysis before collecting data.
Clean your dataset carefully.
Choose statistical tests that match your research objectives.
Understand the assumptions behind each test.
Present results using clear tables and charts.
Interpret findings rather than simply reporting numbers.
Relate results to previous research.
Proofread the results chapter before submission.
Why Choose AssignmentCart?
AssignmentCart provides ethical academic support for dissertation data analysis through:
SPSS guidance
Statistical concept support
Data interpretation assistance
Research methodology guidance
Academic editing
Proofreading
Referencing assistance
Confidential communication
Our focus is on helping students understand statistical analysis and present their own research confidently while maintaining academic integrity.
Final Thoughts
Data analysis is one of the most important stages of dissertation research. Learning how to organise data, choose appropriate statistical tests, interpret results, and present findings clearly can significantly improve the quality of your dissertation.
Ethical SPSS data analysis help for dissertations—through statistical guidance, methodology support, output interpretation, proofreading, and academic coaching—can strengthen your research skills while ensuring your dissertation remains your own original academic work.
Frequently Asked Questions
Everything you need to know about our services
Related Posts

Dissertation Editing Services: Improve Your Dissertation Before Submission

Dissertation Proposal Help: A Complete Guide for University Students
