SPSS Analysis Help for New Zealand Dissertations
Introduction
Statistical analysis can be one of the most challenging stages of a Master's dissertation or PhD research project. You may have collected your survey responses and entered the data into SPSS, but knowing which statistical test to use, how to interpret the output, and how to present the findings academically can be much more difficult.
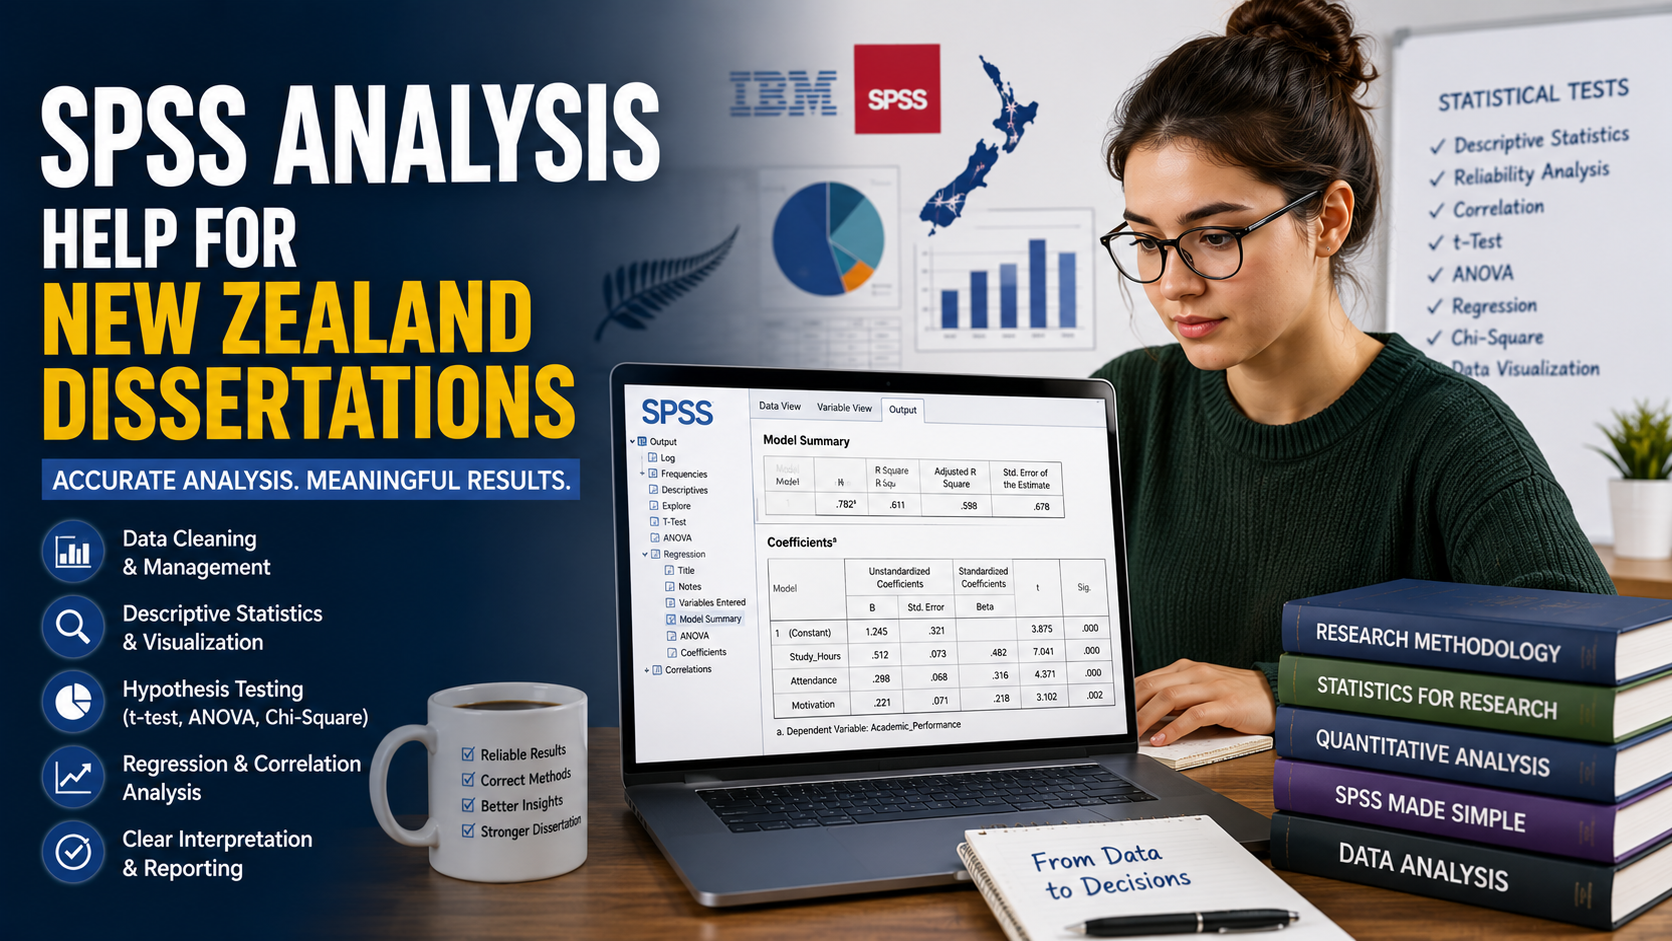
For students studying at New Zealand universities, dissertation research may involve quantitative surveys, experiments, questionnaires, secondary datasets, or other forms of numerical research. When the analysis becomes complicated, students can struggle with everything from data cleaning and variable coding to hypothesis testing, regression, correlation, and interpretation.
This is where appropriate SPSS analysis help for New Zealand dissertations can be useful.
Whether you are working on a Master's dissertation, research project, or PhD thesis, understanding the statistical process is essential. Your analysis should be driven by your research questions and research design—not simply by the SPSS options available in the software.
This guide explains the SPSS analysis process, common statistical tests, mistakes students make, and how academic support can help you improve your dissertation analysis.
What Is SPSS?
SPSS, commonly known as IBM SPSS Statistics, is statistical software used to manage, analyse, and interpret quantitative data.
Researchers and students can use SPSS for tasks such as:
Data entry and management
Data cleaning
Descriptive statistics
Frequency analysis
Reliability testing
Correlation analysis
Regression analysis
t-tests
ANOVA
Non-parametric tests
Hypothesis testing
Data visualisation
SPSS can perform statistical calculations quickly, but the software does not decide whether a particular test is appropriate for your research question.
That decision requires statistical and methodological reasoning.
Why Is SPSS Analysis Difficult for Dissertation Students?
The biggest challenge is often not operating the software.
The real difficulty is deciding:
What analysis should I perform, and what does the output actually mean?
For example, a student may know how to run a correlation in SPSS but still be unsure:
Whether correlation is appropriate
Which variables should be included
Whether assumptions have been met
How to interpret the correlation coefficient
Whether the result is statistically significant
How to report the finding
Whether the result supports the research hypothesis
This is why statistical analysis should begin with your research questions, hypotheses, variables, and research design.
What Can SPSS Be Used for in a Dissertation?
SPSS can support many types of quantitative dissertation analysis.
The appropriate technique depends on your research design and the type of data you have collected.
Common applications include:
Descriptive statistics
Used to summarise your dataset.
Reliability analysis
Used to evaluate the internal consistency of multi-item scales.
Correlation
Used to examine relationships between variables.
Regression
Used to investigate relationships between a dependent variable and one or more predictors.
t-tests
Used to compare means between groups or conditions in appropriate situations.
ANOVA
Used to compare means across multiple groups or conditions.
Non-parametric tests
Used in situations where assumptions required for certain parametric tests are not satisfied or where the data structure calls for an alternative method.
The correct choice depends on your research question, variables, measurement level, assumptions, and study design.
Step 1: Understand Your Research Questions
Before opening SPSS, identify exactly what your research is trying to discover.
Suppose your dissertation asks:
"Is employee engagement associated with job satisfaction among employees in New Zealand organisations?"
You might have:
Independent or predictor variable: Employee engagement
Dependent variable: Job satisfaction
A correlation analysis may be relevant if the variables and assumptions support it.
Now consider a different question:
"Does job satisfaction differ between employees working remotely, hybrid, and entirely on-site?"
This involves comparing groups, so a different analytical approach may be appropriate.
The important principle is:
Research question → Variables → Data type → Statistical test
Not:
Open SPSS → Choose a test → Find something significant
Step 2: Understand Your Variables
Before conducting statistical analysis, identify the variables in your dataset.
A variable might represent:
Age
Gender
Income
Academic performance
Survey score
Employee satisfaction
Customer loyalty
Stress level
Hours worked
Study hours
You also need to understand how each variable is measured.
Common measurement levels include:
Nominal
Ordinal
Scale/continuous
The measurement level can influence which statistical procedures are appropriate.
For example, a categorical variable such as department is treated differently from a continuous measure such as annual income.
Step 3: Clean Your SPSS Dataset
Data cleaning is an important stage of quantitative research.
Before running your main analysis, check for:
Missing values
Duplicate cases
Incorrect coding
Impossible values
Data-entry errors
Outliers
Inconsistent categories
Incorrect variable types
For example, if age should range between 18 and 80 but your dataset contains an age of 250, something needs to be investigated.
Don't simply delete unusual observations because they make your results look better.
Investigate them and document appropriate decisions.
Step 4: Code Your Data Correctly
Survey data often needs to be converted into numerical codes before analysis.
For example:
Response | Code |
|---|---|
Strongly disagree | 1 |
Disagree | 2 |
Neutral | 3 |
Agree | 4 |
Strongly agree | 5 |
You need to maintain consistent coding throughout the dataset.
Incorrect coding can produce misleading statistical results.
Pay particular attention to:
Reverse-coded items
Missing-value codes
Categorical variables
Dummy variables
Scale construction
Step 5: Conduct Descriptive Statistics
Descriptive statistics provide an overview of your data before you perform more advanced analysis.
Depending on your variables, you might examine:
Frequency
Percentage
Mean
Median
Standard deviation
Minimum
Maximum
Range
For categorical variables, frequency tables can show how many participants fall into each category.
For continuous variables, measures such as the mean and standard deviation can provide an overview of the distribution.
A dissertation should generally present descriptive findings clearly before moving into inferential analysis.
Step 6: Check Reliability
If your questionnaire uses multiple items to measure a construct, you may need to assess internal consistency.
One commonly reported measure is Cronbach's alpha.
For example, suppose you use five questionnaire items to measure employee satisfaction.
You may examine whether those items demonstrate an appropriate level of internal consistency for your research context.
However, don't treat a particular alpha value as a universal guarantee that a scale is "good" or "bad."
Interpret reliability alongside:
The number of items
The construct being measured
The research context
Existing validation evidence
The intended use of the scale
Step 7: Choose the Correct Statistical Test
This is one of the most important parts of SPSS dissertation analysis.
The appropriate test depends on what you are trying to determine.
A simplified guide is:
Research Objective | Possible Analysis |
|---|---|
Describe a dataset | Descriptive statistics |
Examine association between variables | Correlation |
Predict an outcome from predictors | Regression |
Compare two groups | t-test |
Compare three or more groups | ANOVA |
Analyse categorical associations | Chi-square |
Analyse data when parametric assumptions are unsuitable | Appropriate non-parametric test |
This table is only a starting point.
You should consider the research question, variable types, study design, sample characteristics, and statistical assumptions before selecting a test.
Correlation Analysis
Correlation analysis can be used to examine the relationship between two variables when the assumptions and measurement structure are appropriate.
For example:
Is there a relationship between weekly study hours and academic performance?
A correlation coefficient can indicate the direction and strength of an association.
A positive association means that higher values of one variable tend to be associated with higher values of the other.
A negative association means that higher values of one variable tend to be associated with lower values of the other.
However:
Correlation does not automatically establish causation.
If two variables are correlated, you should not automatically conclude that one causes the other.
Regression Analysis
Regression analysis can help researchers examine how one or more predictor variables relate to an outcome variable.
For example, a dissertation might examine whether:
Study hours
Academic motivation
Attendance
are associated with:
Academic performance
A regression model may provide information about the relationship between the predictors and the outcome.
Depending on the model, you may need to interpret statistics such as:
Coefficients
Standard errors
p-values
Confidence intervals
R-squared
Adjusted R-squared
The exact statistics you report depend on the regression model and research design.
t-Test Analysis
A t-test may be appropriate when comparing two groups or conditions under the relevant assumptions.
For example:
Do students who participate in a particular learning programme have different average test scores from students who do not?
Different forms of t-tests are used for different research designs.
These can include:
Independent-samples t-test
Paired-samples t-test
One-sample t-test
The choice depends on the relationship between the observations and the research question.
ANOVA Analysis
ANOVA can be used to compare means across multiple groups under appropriate conditions.
For example:
Does employee satisfaction differ between employees working in three different organisational departments?
If an overall ANOVA is statistically significant, further analysis may be needed to determine which groups differ.
Students should not simply report that ANOVA was "significant" without explaining what the result means in relation to their research question.
Chi-Square Analysis
Chi-square procedures can be useful for examining associations between categorical variables.
For example:
Is employment status associated with participation in professional training?
Both variables are categorical.
The analysis can help determine whether the observed distribution is consistent with the null hypothesis under the assumptions of the selected test.
Statistical Assumptions Matter
One of the biggest mistakes students make is choosing a statistical test without checking whether its assumptions are reasonably satisfied.
Depending on the analysis, assumptions may include considerations such as:
Independence
Normality
Linearity
Homoscedasticity
Absence of problematic multicollinearity
Appropriate measurement level
Adequate sample characteristics
You should understand which assumptions apply to your chosen analysis and how they can be assessed.
Don't mechanically run every assumption test available in SPSS.
The relevant checks depend on the statistical procedure and research design.
How to Interpret SPSS Output
SPSS can produce extensive output.
You may see:
Descriptive statistics
Correlation matrices
ANOVA tables
Coefficients
Model summaries
Significance values
Confidence intervals
Test statistics
The challenge is knowing which information actually matters.
For example, suppose your regression output shows a statistically significant coefficient.
Don't simply write:
"The SPSS output was significant."
Instead, explain:
Which variable was associated with the outcome
The direction of the relationship
The relevant effect estimate
The uncertainty around the estimate where appropriate
Statistical significance
The practical meaning
Whether the finding supports the research hypothesis
Statistical output needs to be translated into an academic argument.
Statistical Significance Is Not the Same as Practical Importance
A statistically significant result does not automatically mean that the finding is important in practice.
Consider two studies.
A very large sample might detect a statistically significant difference that is extremely small.
A smaller study might fail to detect statistical significance even though a potentially meaningful effect exists.
Therefore, where appropriate, consider:
Effect size
Confidence intervals
Magnitude of differences
Practical relevance
Sample size
Research context
Your interpretation should go beyond simply reporting whether p < .05.
How to Report SPSS Results in a Dissertation
Your results chapter should present findings clearly and objectively.
For example, rather than writing:
"There was a significant result."
A stronger report might explain:
"The analysis indicated a statistically significant positive association between the two variables, suggesting that higher values of one measure were associated with higher values of the other."
The exact reporting format should follow your discipline, university requirements, and preferred referencing or style guide.
You should also distinguish between:
Results
What the statistical analysis found.
Discussion
What those findings might mean in relation to previous research and your research question.
Avoid mixing extensive interpretation into a purely descriptive results section if your dissertation structure separates results and discussion.
SPSS Tables and Figures
Tables can make statistical results easier to understand.
Depending on your analysis, you might present:
Participant characteristics
Descriptive statistics
Reliability results
Correlation matrices
Regression coefficients
Group comparisons
ANOVA results
Figures might include:
Bar charts
Histograms
Scatterplots
Boxplots
Other appropriate visualisations
Don't insert every SPSS-generated table into your dissertation.
Select only the output that directly supports your research questions.
Common SPSS Dissertation Mistakes
Mistake 1: Choosing Tests Based on Convenience
Don't select a statistical test because it is easy to run in SPSS.
Select it because it is appropriate for your research question and data.
Mistake 2: Running Every Available Test
More statistical tests do not automatically produce a stronger dissertation.
Unnecessary analyses can make your research confusing and increase the risk of inappropriate interpretation.
Mistake 3: Ignoring Missing Data
Missing responses can affect your analysis.
Understand how missing values are represented and how your chosen procedures handle them.
Mistake 4: Ignoring Outliers
Outliers can sometimes substantially influence statistical estimates.
Investigate unusual observations rather than automatically deleting them.
Mistake 5: Reporting Only p-Values
A p-value alone rarely tells the complete story.
Where appropriate, report effect estimates, confidence intervals, effect sizes, and relevant descriptive information.
Mistake 6: Treating Correlation as Causation
An association between two variables does not automatically demonstrate that one causes the other.
Mistake 7: Copying SPSS Output Directly Into the Dissertation
Raw software output is rarely suitable for direct inclusion.
Select and format the relevant information according to your university's academic requirements.
Mistake 8: Changing the Analysis Until Something Is Significant
Statistical analysis should be guided by your research design and hypotheses—not by a desire to obtain a particular p-value.
How to Organise Your SPSS Dissertation Analysis
A useful workflow is:
Step 1
Review your research questions and hypotheses.
Step 2
Identify your dependent, independent, and other relevant variables.
Step 3
Check your dataset and coding.
Step 4
Clean the data and document appropriate decisions.
Step 5
Run descriptive statistics.
Step 6
Assess relevant assumptions.
Step 7
Conduct the appropriate inferential analyses.
Step 8
Interpret the results.
Step 9
Create clear tables and figures.
Step 10
Connect the findings to your research questions.
Step 11
Discuss the findings in relation to previous research.
This process helps prevent the common mistake of starting with statistical tests before understanding what the research is actually asking.
SPSS Analysis for New Zealand Dissertations
If you are completing a dissertation at a New Zealand university, your statistical analysis should follow the requirements of your programme and discipline.
Requirements can differ depending on whether you are studying:
Business
Management
Marketing
Psychology
Education
Nursing
Public Health
Social Sciences
Economics
Engineering
Information Systems
Other quantitative disciplines
Your supervisor or research methods guidance should help determine the appropriate analytical approach.
For example, a statistical method that is common in one discipline may not be appropriate for another research design.
When Should You Get SPSS Analysis Help?
Consider seeking appropriate academic guidance if:
You don't know which statistical test to use.
You are confused about SPSS variables and coding.
Your dataset contains missing values.
You are unsure how to interpret statistical output.
You don't understand regression results.
You are struggling with hypothesis testing.
You need help understanding statistical assumptions.
Your supervisor has asked you to revise your analysis.
You are unsure how to present SPSS results in your dissertation.
You need your completed statistical analysis reviewed.
Getting help earlier can give you time to discuss methodological decisions with your supervisor before final submission.
SPSS Analysis Help for New Zealand Dissertation Students
AssignmentCart provides academic support for students working on dissertations, research projects, theses, assignments, and other university-level academic work.
For students working with SPSS, appropriate support can focus on areas such as:
Understanding SPSS procedures
Data organisation
Variable coding
Data-cleaning guidance
Statistical-test selection
Descriptive statistics
Correlation analysis
Regression analysis
t-tests
ANOVA
Interpretation of statistical output
Results presentation
Academic writing
Editing and proofreading
If you already have your analysis completed, support can also focus on improving the clarity and academic presentation of your results.
Students should ensure that any external academic support complies with their university's academic-integrity, third-party assistance, and assessment policies.
What to Prepare Before Getting SPSS Help
If you are seeking statistical guidance, having the following information available can make the process more useful:
Research question
Research objectives
Hypotheses
Variable list
Questionnaire or measurement scales
Sample information
Dataset
Research methodology
Supervisor feedback
Required statistical tests, if specified
University formatting requirements
The more clearly your research design is understood, the easier it is to evaluate whether your planned analysis is appropriate.
SPSS Dissertation Analysis Checklist
Before submitting your dissertation, check:
Data
Is the dataset correctly coded?
Have missing values been investigated?
Have potential errors been checked?
Have relevant outliers been considered?
Analysis
Does every statistical test answer a research question?
Are the assumptions of the chosen tests considered?
Are the methods consistent with your research design?
Results
Are the findings accurately reported?
Are important statistics included?
Are tables clearly labelled?
Are figures relevant and readable?
Interpretation
Have you avoided overstating your findings?
Have you distinguished association from causation?
Have you considered practical significance where relevant?
Are the findings connected to your hypotheses?
Dissertation
Does the analysis answer the research questions?
Is the results chapter logically organised?
Does the discussion connect findings to previous research?
Have you followed your university's requirements?
Conclusion
SPSS can make quantitative dissertation analysis more manageable, but the software itself does not replace statistical reasoning.
The strongest dissertation analyses begin with a clear research question and then select statistical procedures that are appropriate for the research design, variables, data, and hypotheses.
A useful process is:
Research Question → Variables → Data Preparation → Descriptive Analysis → Assumption Checks → Statistical Test → Interpretation → Results → Discussion
If you are struggling with SPSS analysis for a New Zealand dissertation, appropriate academic support can help you understand your statistical options, review your analytical approach, interpret output, and present findings more clearly.
The goal should not be to produce as many statistical tests as possible or obtain a particular significance value. The goal is to conduct an analysis that is methodologically appropriate, transparent, accurately interpreted, and directly connected to your research questions.
If you are working toward a dissertation deadline, getting statistical guidance early can also give you time to discuss your analysis with your supervisor and make appropriate revisions before submission.
Frequently Asked Questions
Everything you need to know about our services
Related Posts

SPSS Analysis Help for Singapore MBA Students

SPSS Analysis Help for Business Dissertations in Ireland
